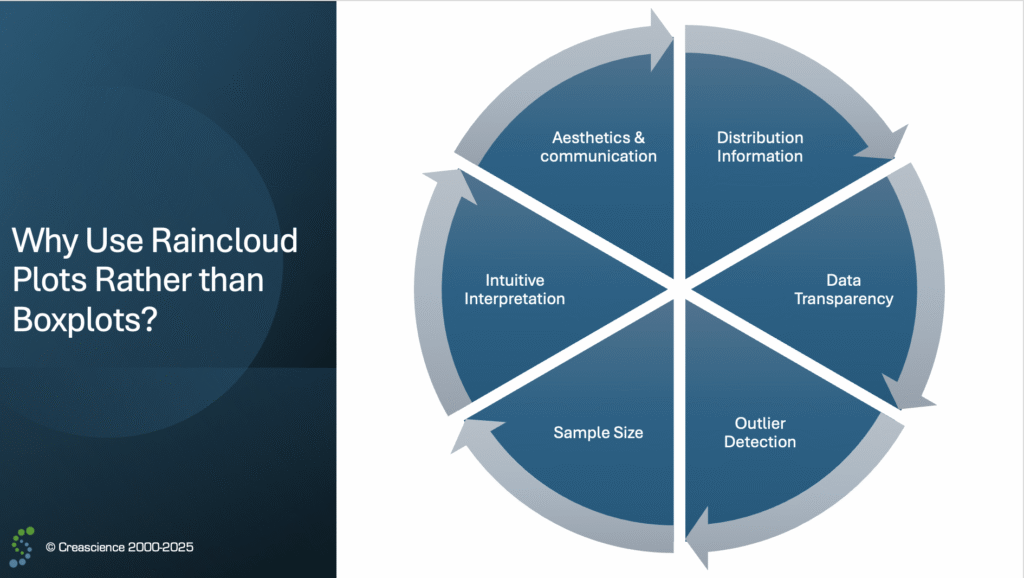
Context
Raincloud plots are becoming increasingly popular in biomedical research, particularly in preclinical biostatistics.
Example of Raincloud Plot of Fuel Efficiency by Car Origin – A Case Study Used in Our Training Sessions
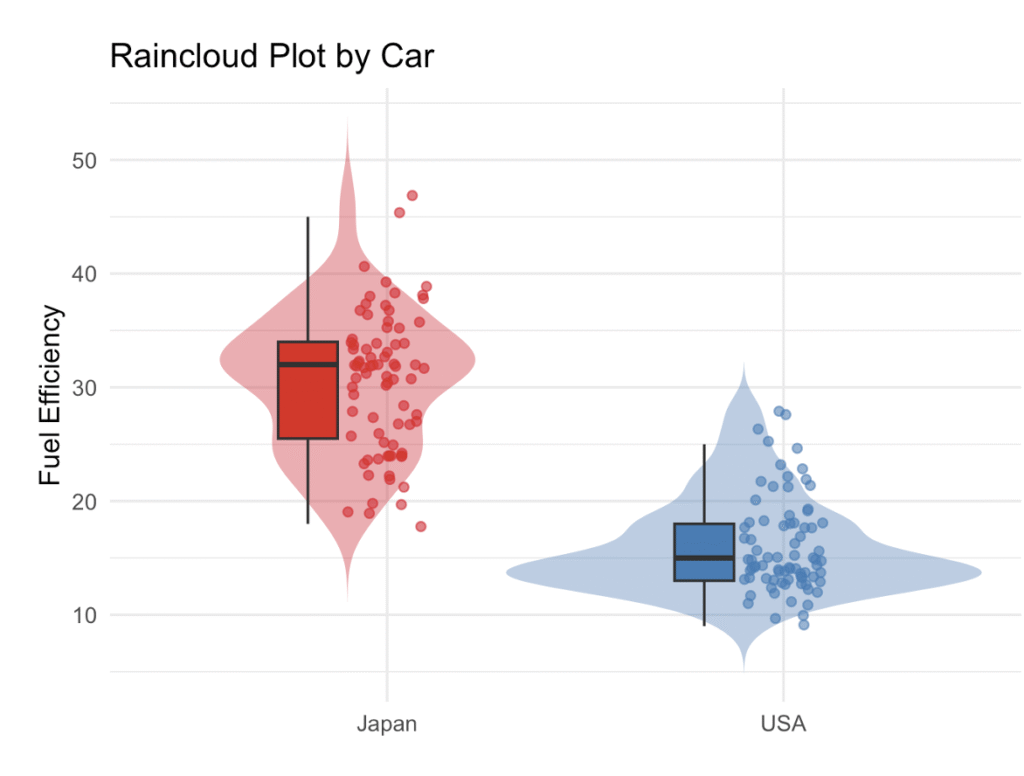
Information on the Data Distribution
- Boxplot: Shows quartiles and the median, but not the shape of the distribution
- Raincloud plot: Combines a violin or half-violin plot, depicting the distribution density with individual points and a summary (mean/median)
- Advantage of the raincloud plot: Complete visualization of the distribution (symmetry, multimodality, outliers, etc.)
Data Transparency
- Boxplot: Individual data points are hidden
- Raincloud plot: Raw data is visible as a scatter plot (rain)
- Advantage of the raincloud plot: Promotes transparency and reproducibility
Detection of Outliers
- Boxplot: Automatic but sometimes arbitrary (depending on IQR)
- Raincloud plot: Individual points are directly visible
- Advantage of the raincloud plot: Allows evaluation of whether outliers are real or artifacts
Sample Size
- Boxplot: Can give a misleading impression if n is small
- Raincloud plot: The number of points directly reflects n
- Advantage of the raincloud plot: Useful for assessing statistical robustness
Intuitive Interpretation
- Boxplot: Quick but abstract summary
- Raincloud plot: Distribution + individuals + summary
- Advantage of the raincloud plot: Combines the advantages of the boxplot, violin plot, and dotplot
Aesthetics & Communication
- Boxplot: Simple, sometimes not very informative
- Raincloud plot: Visual, intuitive, suitable for popular science
- Advantage of the raincloud plot: Ideal for presentations, articles, and journal figures
In Brief
🔹 The boxplot summarizes the data distribution.
🔹 The raincloud plot shows the data distribution.
Raincloud plots are therefore preferable when:
- the samples are small or unequal;
- the shape of the distribution is important (e.g., skewness, multimodality);
- individual variability is to be shown in addition to an overall summary.