Fundamental Statistical Methods for Engineers

In today’s data-rich engineering environments, a solid grasp of fundamental statistical methods is essential. Engineers routinely face variability in materials, processes, and measurements — and statistics provides the tools to understand, model, and c …
Fundamentals Statistical Tools

This workshop offers an introduction to the fundamental principles and concepts in statistics. The first part covers classical and more recent exploratory data analysis (EDA) techniques to describe data with numerical and graphical tools. The various uses of these methods such as outlier detection is discussed. The second part addresses, with the help of real-life examples, the principles underlying statistical testing and decision-making in the presence of uncertainty. It covers risks involved, effect size, p-values as well as statistical significance and practical relevance. The use and interpretation of confidence intervals is also discussed. An excellent introductory module and a solid basis for all other courses.
Masterclass: Best Statistical Practices for the Life Sciences

A 3-hour workshop during which the key elements of the recommendations and regulations of the various government agencies (Health Canada, FDA, EMA, etc.) are presented with their concrete implications on the practices to be respected. Aimed at both management teams and scientific staff, the workshop allows stakeholders to be made aware of these issues. In itself, the workshop is sufficient to allow startups to self-assess their practices and offer them tools to improve the points they consider problematic.
Three Serious Games to Understand the Role of Statistics in R&D

These three (3) half-day workshops are part of the launch of our mentoring program, but can also be offered independently. Their goal is to raise awareness among research teams about the role of statistics in the various stages of the research process …
Biostatistics in the Medical Literature

Become more confident when discussing clinical results with leading healthcare providers. This course covers key biostatistical concepts required to review and interpret findings published in the biomedical literature. The exact course curriculum is tailored to the therapy area of interest. Selected scientific publications are reviewed, discussed and criticised.
Engineering Applications of Machine Learning

Artificial Intelligence (AI) has become a prominent sale argument no matter whether you want to buy a simple toaster or an advanced assembly line robot. The purpose of this seminar is to demystify the jargon used and to provide attendees with the tools …
Introduction to the Design of Experiments ‘DOE’

Variation is present in every experiment. Learn about DoE techniques to control variation, and to maximise data quality. This workshop presents classical techniques to design efficient experiments as well as the tools to analyze their results. The principles of sample size calculations, strategies to remove undesirable sources of variability like the use of blocks and controls, as well as the most commonly used experimental designs are discussed. The statistical analysis of designed experiments is progressively introduced, starting with the t-test method used to compare two groups. Then, the analysis of variance technique (ANOVA) is extensively covered from simple one-factor experiments to more advanced multi-factor situations where the interaction between factors needs to be considered. Multiple comparisons techniques used to locate differences are also presented.
Advanced Experimental Designs

Learn about advanced experimental designs to account for experimental various types of constraints such as time, available resources, material heterogeneity, randomization restrictions when certain factors are more difficult or costly to change than others, different sizes of experimental units as well as repeated measures. In this course, the construction of advanced designs and their statistical analysis is covered with the help of real case studies.
Statistical Analysis of Metagenomics Data

Metagenomic data have specific characteristics that require adapted statistical methods. Discover the most commonly used statistical tools in this field. The training begins with a reminder of hypothesis testing, associated risks, multiplicity and how to control them. Then learn what are the specificities and problems of genomic data. The training reviews classic tests for comparing groups (ANOVA, MANOVA) and their extension to tests adapted to genomic data (ANOSIM and PERMANOVA). Data visualization tools and choice of a distance metric are also discussed.
Linear Regression Modelling Techniques

The linear regression is a method used to model the relationship between a dependent variable and one or more independent variables by fitting a linear equation to observed data. Building a regression model with stats packages has become straightforward. However, interpreting the software output and building a good model are no simple tasks. Learn about statistical modeling with a focus on linear models. What is a model? Estimating and interpreting model coefficients. Dealing with continuous and categorical predictors and interactions. Evaluating model performance: explanatory vs. predictive. Common pitfalls and best practices.
Screening Techniques in DOE

In preliminary research phases, the number of potentially influential factors to investigate is usually large. Screening designs are experimental designs used to identify the most influential factors that influence a response or outcome in a process or system with a reasonable number of runs. These designs are typically used in the early stages of experimentation, when you want to quickly assess a large number of variables to determine which ones have the greatest effect on the response variable. The goal is to eliminate unimportant factors and focus resources on the most influential ones. Learn about the construction of fractional factorial designs, aliasing and de-aliasing strategie. A working knowledge of multiple linear regression is needed to make the most out of this workshop.
Optimisation Designs

Optimization designs refer to experimental design strategies that are specifically structured to optimize a process, product, or system. The goal of these designs is to identify the combination of factors (inputs) that lead to the best possible outcome (response) according to a defined objective, such as maximizing performance, minimizing cost, or finding the most efficient operating conditions. Learn more about experimental designs when influential factors have been identified and the goal is to optimize their levels. Principle underlying the construction of composite and Box-Behnken design are covered. Principle, model-building, and response surface methodology are reviewed.
Regression Modelling Techniques for Categorical Data

Linear regression is inappropriate to model binary responses such as pass/fail, survived/died. Learn the principle of logistic regression part of the Generalized Linear Models along with its similarities with linear regression and its specific tools. Good practices for model-building and for assessing model goodness-of-fit are presented.
Shelf-Life & Stability Studies – Design & Analysis

Shelf-life data possess specific features so that their design and analysis require adapted statistical tools. This workshop uses a variety of case studies to present the most important aspects to consider for a sound determination of product shelf life. Starting from the assessment of the differences between shelf-life and stability studies, participants learn for each type of study how to design efficient experiments to determine the failure time of products accurately. The issues discussed include the timepoint selection, how to handle destructive testing, the experiment size and the choice of samples. The workshop also emphasizes the appropriate ways to analyze life data and to adequately interpret and communicate the results obtained. The principle of accelerated shelf-life testing (ASLT) along with the conditions for a successful use are discussed.
Sample Size & Power Determination
Efficient experiments must be large enough to detect meaningful scientific differences and maximize the use of available resources. Learn about sample size and power calculations.
Design & Analysis of Survival Studies
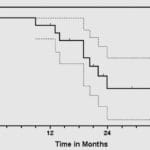
Lifetime data possess specific features so that their design and analysis require adapted statistical tools.This workshop uses a variety of case studies to present the most important aspects to consider for a sound determination of survival curves. Participants learn for each type of study how to design efficient experiments to determine the survival time of patients. The issues discussed include the timepoint selection, how to handle censoring (incomplete observations), competing risks, and the experiment size. The workshop also emphasizes the appropriate ways to analyze life data, how to compare curves, how to account for time-varying covariates and to adequately interpret and communicate the results obtained.
Statistical Methods for Reliability Studies

Reliability studies are a type of research or experimental design focused on assessing and improving the reliability of systems, products, or processes. In these studies, the goal is to determine how consistently and dependably a system or product performs over time and under varying conditions. Reliability refers to the ability of a product, system, or component to function as intended without failure, across its expected lifespan or under specified conditions. In industrial applications, reliability is crucial and testing is expensive. Collected data must be exploited in the best way possible. Reliability data possess specific features that call for dedicated statistical methods. Learn about statistical tools for reliability analysis.
Principal Component Analysis

Learn about Principal Component Analysis, a data reduction technique, to identify, quantify & visualise the structure of a set of measurements. PCA provides insightful data visualisation tools. Learn about innovative applications. During the workshop, emphasis is put on the principles and the conditions of utilization of the method, the results they provide and their interpretation. Plenty of time is devoted to case studies and interpretation of software output.
Cluster Analysis – Unsupervised Learning

Learn how to take data (consumers, genes, …) and organise them into homogeneous groups for use in many applications, such as market analysis and biomedical data analysis, or as a pre-processing step for many data mining tasks. Learn about this very active field of research in statistics and data mining, and discover new techniques. Learn about innovative applications. During the workshop, emphasis is put on the principles and the conditions of utilization of the method, the results they provide and their interpretation. Plenty of time is devoted to case studies and interpretation of software output.
Introduction to Biostatistics

Learn about key biostatistical concepts and efficient tools for summarising & visualising data. Demystify the statistical testing approach used to make decision in the presence of uncertainty.